


The time had come to do a little maintenance on our Nissan Leaf battery. We slid our battery into the bay on October 22, 2017 - well over 3 years ago! I am happy to report that the performance of the battery and solar system has exceeded our expectations. That is not to say that absolutely everything has been 100% perfect, but overall the system has been performing very well. For this project, we did a full check-up on the battery and addressed the few things that have been bugging us, including a full capacity test from empty to full.
For a little background information, if you are newer to our build, we live in the Phoenix area. We are finishing the build of our bus on a piece of property with no utilities at all (no water or power). All the power we need for the build has to come from our solar and Nissan Leaf house battery. We usually work on the bus at this property four days per week with our four kids. As you can imagine, it gets very hot in our area in the summer (in fact, 2020 was the hottest summer ever recorded in Arizona history). So, with six of us out there working in 110-115°F temperatures, we not only needed to run all of our power tools, we also needed to run three or four air conditioners all day long. Amazingly, most days, this was no problem. Our 4350 Watts of solar was easily keeping up with our air conditioners and power tools and could still trickle charge our battery on most days. Arizona is extremely sunny but there were days where it was cloudy, rainy, or even smokey (from fires in California) where we were not able to harvest our normal quantity of solar power. These days we are thankful for having a very large capacity battery.


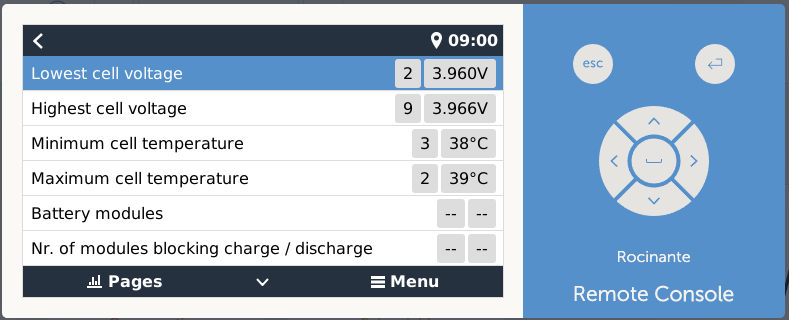
While everything was mostly smooth sailing in the power department, we had a strange issue. This was especially noticeable before we added capacity to our solar array. If we had three or four days of consecutive clouds in the extreme heat (107+°F), we would run at a deficit in power - losing more and more each day until around day three or four, where we would no longer be able to keep up. Worse than that, when our battery did give up, the SOC that our BMS reported would drop from 30% or 40% battery capacity to 2% capacity instantly. Similarly, when we charged the battery back up it would act normally until it reached 85% or 90% and then the SOC would "jump" to 100%. After the second time observing this, we called REC (our BMS manufacturer) to try to figure out what was going on. They were very helpful and said it could be one of many scenarios, the worst of which might be that we were experiencing a bad cell. To know if it was a bad cell, we would need a way to observe the highest and lowest voltage through a full charge/discharge cycle. The good news is that they had a firmware update that would display the maximum cell Voltage and minimum cell Voltage on our Victron display.
I also spoke to my good friend Aaron (Broccoli Bus), and he suggested that he had a similar behavior happen when he had a loose connection on one of his cells. He suggested I just check all the cells to be sure this was not the case.
Battery Checkup
Armed with this information, we removed the air conditioner in the bay for easier access to our battery and got to work checking all the battery modules. Little by little, we removed the protective plastic covers and inspected all the bus bars, bolts, screws, and balance leads. We inspected them for any signs of swelling, leaking, or any discoloration. Everything looked great. Next, with tools wrapped in electrical tape, we checked every single bolt. We did have two bolts that seemed just a tad loose but it was clear that they were still making good connections (there was no heat or evidence of any shorting). We were extremely careful to only work in a small area at a time, keeping all nearby areas fully covered. We recovered the bolts as we moved down the line.


With this task finished, we could effectively rule out that this was a physical problem. It was now time to see if we had either a bad cell or some parameters off somewhere in our system.
The nice thing about chasing down this problem is that we log enough information to be able to quickly determine where the problem might be. If we had a bad cell, the most common way this would show up is that there would be a specific cell that reached "full" or "empty" before any of the other cells. So, for example, if we look at our logs and we constantly see that cell #8 is always the first cell to reach the "empty" threshold and then always the first cell to reach "full" we can effectively narrow down our search to that cell. In our system, a "cell" is actually 14 cells that are wired in parallel. So that task would not be trivial, but at least we would have a great place to start.
Our Victron equipment is great for logging power. We can easily see how much power we have consumed in a day as well as how much we have produced in a day. However, clearly, something was amiss (because we would see the big swings in the state of charge). It really felt like the algorithm was using the information coming from the shunt, doing the counting as expected, THEN some threshold would be hit and it would immediately set the state of charge to 2% (or 100% when we were charging the battery). I again emailed REC-BMS to confirm that my suspicions were correct. They verified that this would indeed happen upon certain thresholds. The dead giveaway was the jump to 2%. Since there was clearly a problem, I decided to get a second battery monitor that would ONLY be responsible for measuring anything coming to and from the battery. This battery monitor would monitor what came out of the main positive lead - DC only.

With all this in place, we were ready to do our first-ever capacity test. A full capacity battery would be around 24 kWh if you used every ounce of energy in that battery. We do not run our battery in this manner. In order to extend the life (according to a few white-papers as much as 10X longer life) and well being of this battery, we have assigned fairly conservative values to "fully charged" and "fully discharged". In the Nissan Leaf, the chemistry is known as Lithium Manganese Oxide (LiMn2O4 with LiNiO2). It is known to have an operating voltage from 4.2V to around 2.5 Volts. Any Voltage higher than 4.2 Volts or lower than 2.5 Volts will damage the battery. We run the battery well inside of those extremes with a max cell Voltage of 4.06 and a minimum cell voltage of 3.2 Volts. While this is better for the battery, it of course comes at the cost of "usable capacity". It is well known that Nissan also does this and limits the car's "usable capacity" to somewhere in the 20 kWh range. With our numbers being even more conservative than those applied by Nissan, we estimated that we should be able to get somewhere in the neighborhood of 17-18 kWh of actual capacity. If it were a brand new battery with no degradation.
Testing
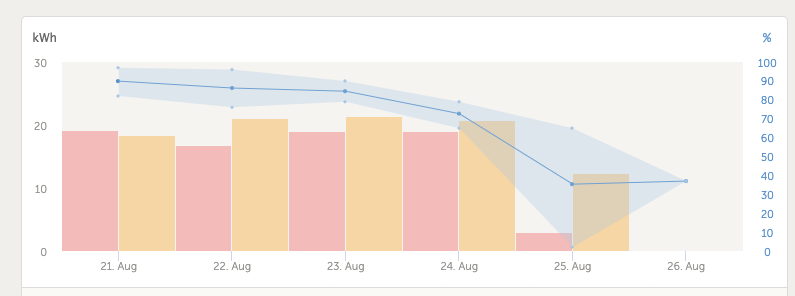
We thought for a while about what might be the most accurate way to test the capacity of the battery. We decided that if we let our battery drain all the way down to 3.2 Volts per cell (~44.8V for the pack or 3.2 Volts for any individual cell) and then charge it back up to 100% with shore power, we could get a very good feel for what our full capacity might be. On the testing day, we simply turned off the breaker to our solar panels, turned off the output breaker from the charge controller, and we were running on the battery for the rest of the day. Our system had already seen some pretty heavy usage that week so we were already down to about 82% battery capacity when we started the test. Fortunately, on that day we were welding some metal, using the air compressor, 2HP table saw, grinders, and a 6hp shop vac. It was still fairly warm in Phoenix so we also had a couple of air conditioners going during the day. By the time we were ready to go home, the battery was starting to run really low.
As the battery was depleting, we discovered that the "crashing to 2%" behavior was actually due to BMS low voltage setting that was incorrectly assigned to 3.4V, so we adjusted that to be 3.2 Volts and started the system back up. That was good news that we found a setting causing the SOC issue. However, we still needed to know the full capacity of our battery in order to have accurate SOC reporting. We continued to draw down the battery, and about 50 minutes later we had our first cell hit 3.2 Volts and the system dropped again to 2% indicated capacity. This was good enough for us. We shut down the system and drove the bus home to be charged from shore power.
Charging
We let the bus charge back up ensuring that the new meter we bought indicated 0 Ah of battery capacity. We have our system set up so that it respects the charging parameters set forth by the REC-BMS. This is a custom curve that is supposed to be much more gentle on the battery - restricting the Amps allowed to charge the battery as it reaches full capacity. As a result, the charging does take a little longer. I was hoping to see the battery reach 100% before I went to bed, but when I went to check it at 2:00 am it was still trickling in a charge.
Results
When we got up the next morning the battery meter was reading 100%. As we had witnessed previously, it had charged according to the algorithm until it reached about 70%, then it shot up 100%. Once at 100% the system stabilized. When we read the meter, it indicated that 275 Ah had been put back in the battery. Finally, we knew what the usable capacity of our system is. When we do the math that puts us at about (275 Ah * 3.8 V * 14 cells) = 14.63 kWh of usable capacity. For reference, this is about the same as 12 Battle Born Batteries (100Ah * 12V * 12 batteries = 14,400 kWh), or if I was using Lead-Acid batteries about the same as roughly 2300 Ah of capacity (using the common 50% max discharge recommendation).
So, what does this mean for us? 14.63 kWh is definitely less than the 17-18kWh we would expect if this was a brand new battery. This is a 7-year old battery that had 30,000 miles in a car and three years as our house battery, working hard in the Arizona desert. Clearly, there has been some degradation in those seven years. Truly, though, it is not bad news. The system is plenty for us, as evidenced by how hard we have made it work all summer. Now, with the new information, we can have an accurate representation of our battery capacity in our settings. After getting this number for the real capacity (not an assumed 17-18kWh), we were able to manually change the setting for the capacity in our BMS. Since then, we have seen much smoother representations of our SOC, and we no longer have to guess if our numbers are correct. We know 90% is 90%, 50% is 50%, etc.
In the end, knowing that our battery, all the connections, bus bars, etc. are in good health, plus knowing the true capacity and having more accurate readings gives us greater peace of mind, knowing that we are good to go moving forward.
Watch the video:
Click here If you cannot see the video.


0 Comments
Comments powered by Disqus